The full Apple deep dive, end to end
What you will learn
- How the finished deep dive is organised, key tables inlined
- Where the document lives and how to get a copy
- What the whole exercise concluded, and what it deliberately did not
- The same three checks on an insurer: the newsletter’s Travelers dive
Everything so far was practice for one artefact: a complete deep dive on Apple, written from the filings.
The document lives in the Deep Dive/AAPL/ folder on the publisher’s machine, in six files: AAPL.md (the write up), AAPL_tables.json (every table), AAPL_dcf.json (the valuation, every assumption explicit), AAPL_audited.json (the self audit from chapter 6), and styled AAPL_deepdive.docx and AAPL_deepdive.pdf. The classroom site cannot serve them, so write to hello@themicrocapminute.in for the Apple deep dive PDF.
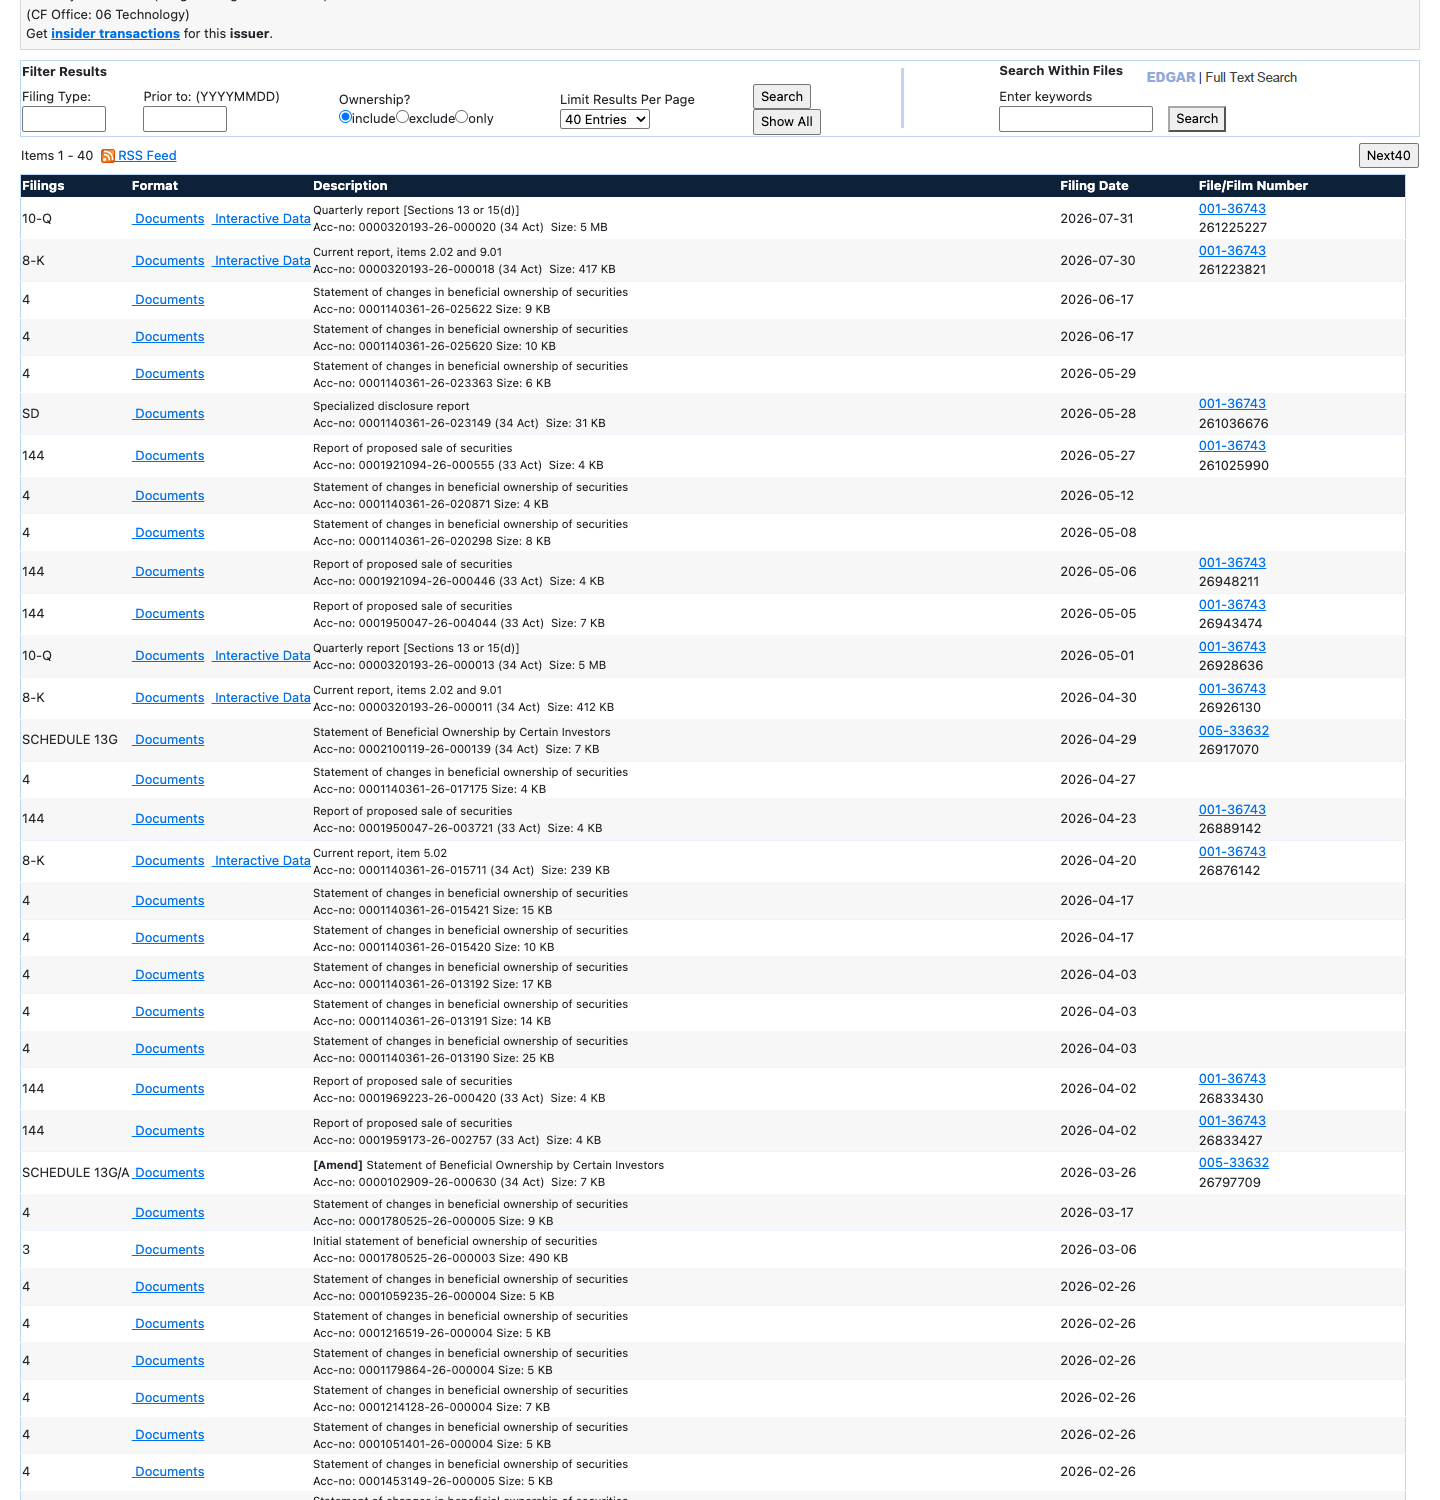
Notice the rhythm: 10-K, then three 10-Qs. Nearly every figure in the dive traces to this page.
The tour, in the document’s own order:
What it does. Devices plus services, from the 10-K: $416.2 billion of revenue in fiscal 2025, the iPhone alone $209.6 billion. Who owns it. No one, and everyone: Vanguard 9.63% and BlackRock 7.10%, mostly index money, while every director and officer together holds 0.06%. The opposite of a promoter run company, a different risk: nobody is truly in charge.
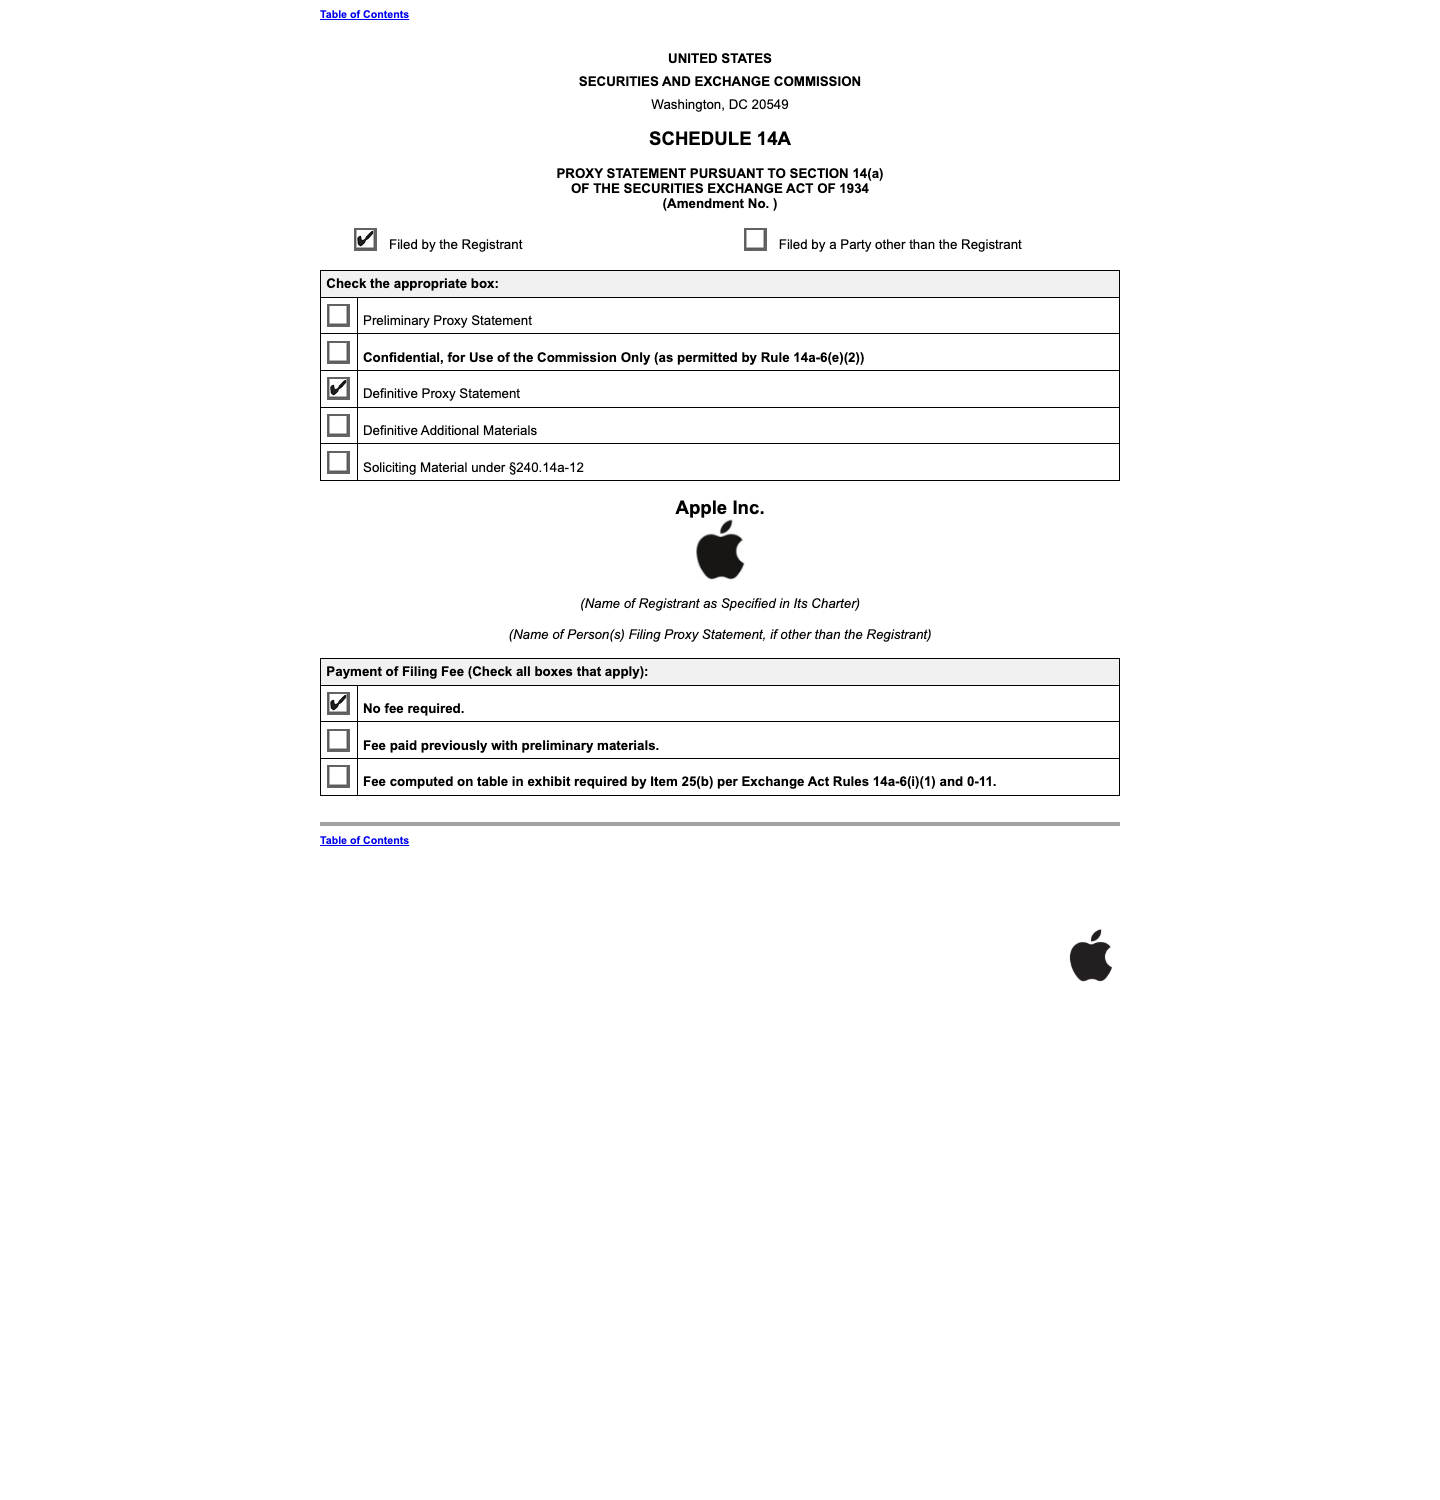
Notice: ownership and pay come from the proxy, not the 10-K: the holders, the board, the chief executive’s $74.3 million pay.
Who buys it. No customer matters; the concentration is upstream (assembly partners in Asia) and in one hidden services payment. The two businesses, the heart of the thesis:
| Measure | FY2023 | FY2024 | FY2025 |
|---|---|---|---|
| Products revenue, $bn | 298.1 | 294.9 | 307.0 |
| Products gross margin | 36.5% | 37.2% | 36.8% |
| Services revenue, $bn | 85.2 | 96.2 | 109.2 |
| Services gross margin | 70.8% | 73.9% | 75.4% |
| Services share of gross profit | 35.7% | 39.3% | 42.2% |
The four quarters (fiscal 2026 is running near 16%), the numbers (gross margin up five straight years to 46.9%), the ten year spine from chapter 4, and where the money went: $713 billion of buybacks plus $142 billion of dividends against $813 billion of free cash flow, which is why net cash fell from $153 billion to $34 billion. Then the detective chapters (the Google payment in no statement, the $10.2 billion State Aid charge), the limits, the moat and the peers.
Finally the valuation. The DCF grid:
| Discount rate | Terminal 2.5% | Terminal 3.0% | Terminal 3.5% |
|---|---|---|---|
| 8.50% | $175.84 | $188.49 | $203.66 |
| 9.17% | $158.33 | $168.23 | $179.86 |
| 10.00% | $140.99 | $148.51 | $157.19 |
Against a price of $308.26, every cell is lower. And the three year view, earnings times an exit multiple, anchored to consensus earnings and the multiples Apple, Microsoft, Meta and Amazon actually trade on.
| Case | EPS, FY2028 | Exit multiple | Price in 2028 | Return a year |
|---|---|---|---|---|
| Bull | 10.72 | 36x | $386 | +8.1% |
| Base | 10.18 | 28x | $285 | (2.2%) |
| Bear | 9.51 | 22x | $209 | (11.6%) |
What did it conclude? That the business is as good as its reputation (rising margins, $136.7 billion of free cash flow, a third of the shares retired) and that the price pays for that reputation twice over: the reverse DCF says $308 assumes double today’s free cash flow forever. Notice what it does not say: never buy, never sell. It hands you the argument, assumptions printed beside it; which one you believe is your decision, not the author’s.
Your second worked example exists, and it is nothing like Apple. The publisher’s weekly newsletter ran the same method on Travelers, a giant US insurer, and the dive sits in the newsletter archive at themicrocapminute.in. The three checks adapt. Business quality: the website says about 30,000 employees, the signed annual report says 34,000, and the filing wins. The moat: a household switches insurer in twenty minutes, so the customer is not locked in; the 13,500 independent agents who sell the policies are. The forensic layer: receivables grew 10% while premiums grew 4%, one line moving the wrong way, printed anyway.
That is the method complete: business quality, moat, forensic checks, valuation, audit. The next company takes a weekend, the tenth an afternoon. The filings are free, the method is yours, and all that is left is repetition.
Try it yourself
Pick one company you use daily (phone maker, browser, favourite drink). Find its latest 10-K on EDGAR, write the four sentence thesis from chapter 2, and build two rows of its ten year spine: revenue and profit, this year and ten years ago, from its financials page (swap in the ticker). You have started your second deep dive.
Key takeaways
- The finished dive is six files in Deep Dive/AAPL/; ask for the PDF at hello@themicrocapminute.in.
- Structure is the method: thesis, ownership, segments, spine, cash, detective work, moat, peers, valuation, risks, sources.
- The valuation disagreed with the price in every cell, without telling anyone what to do.
- The method transfers to any company; the newsletter’s Travelers dive is your second example.
Read one real thing: Apple’s proxy statement, filed 8 January 2026. Find the beneficial ownership table and notice who is not there: no founder, no family, no majority owner. Then find the pay table and judge whether $74.3 million is earned.
StockAnalysis.com links in this module carry The Microcap Minute’s referral code. Nothing in this module is investment advice or a recommendation.
Listen to this chapter
Read by Ritu, a synthetic voice from Sarvam AI