Try It: Apple vs Microsoft in Fifteen Minutes
What you will learn
- How to compare two companies using the same yardsticks
- A simple scorecard you can reuse for any pair of stocks
- How a company’s type of business shows up in its numbers
- Why the goal of a comparison is better questions, not a winner
Everything so far has been warm-up. Now we play a real match. In fifteen minutes, with two free pages, you will compare Apple and Microsoft the way a working analyst begins: same yardsticks, side by side, written down on paper. The aim is not to pick a stock to buy. It is to feel how the same six numbers can tell two very different stories.
Why these two? They are the two biggest companies in America, both sitting on mountains of cash, and yet they make money quite differently. Apple is mostly a hardware company with a fast growing services business attached. Microsoft is mostly software and cloud: Windows, Office, and Azure, its giant business of renting computing power to other companies.
Open both overview pages in two browser tabs: Apple and Microsoft. The stats panels have the same layout, so the numbers line up neatly.
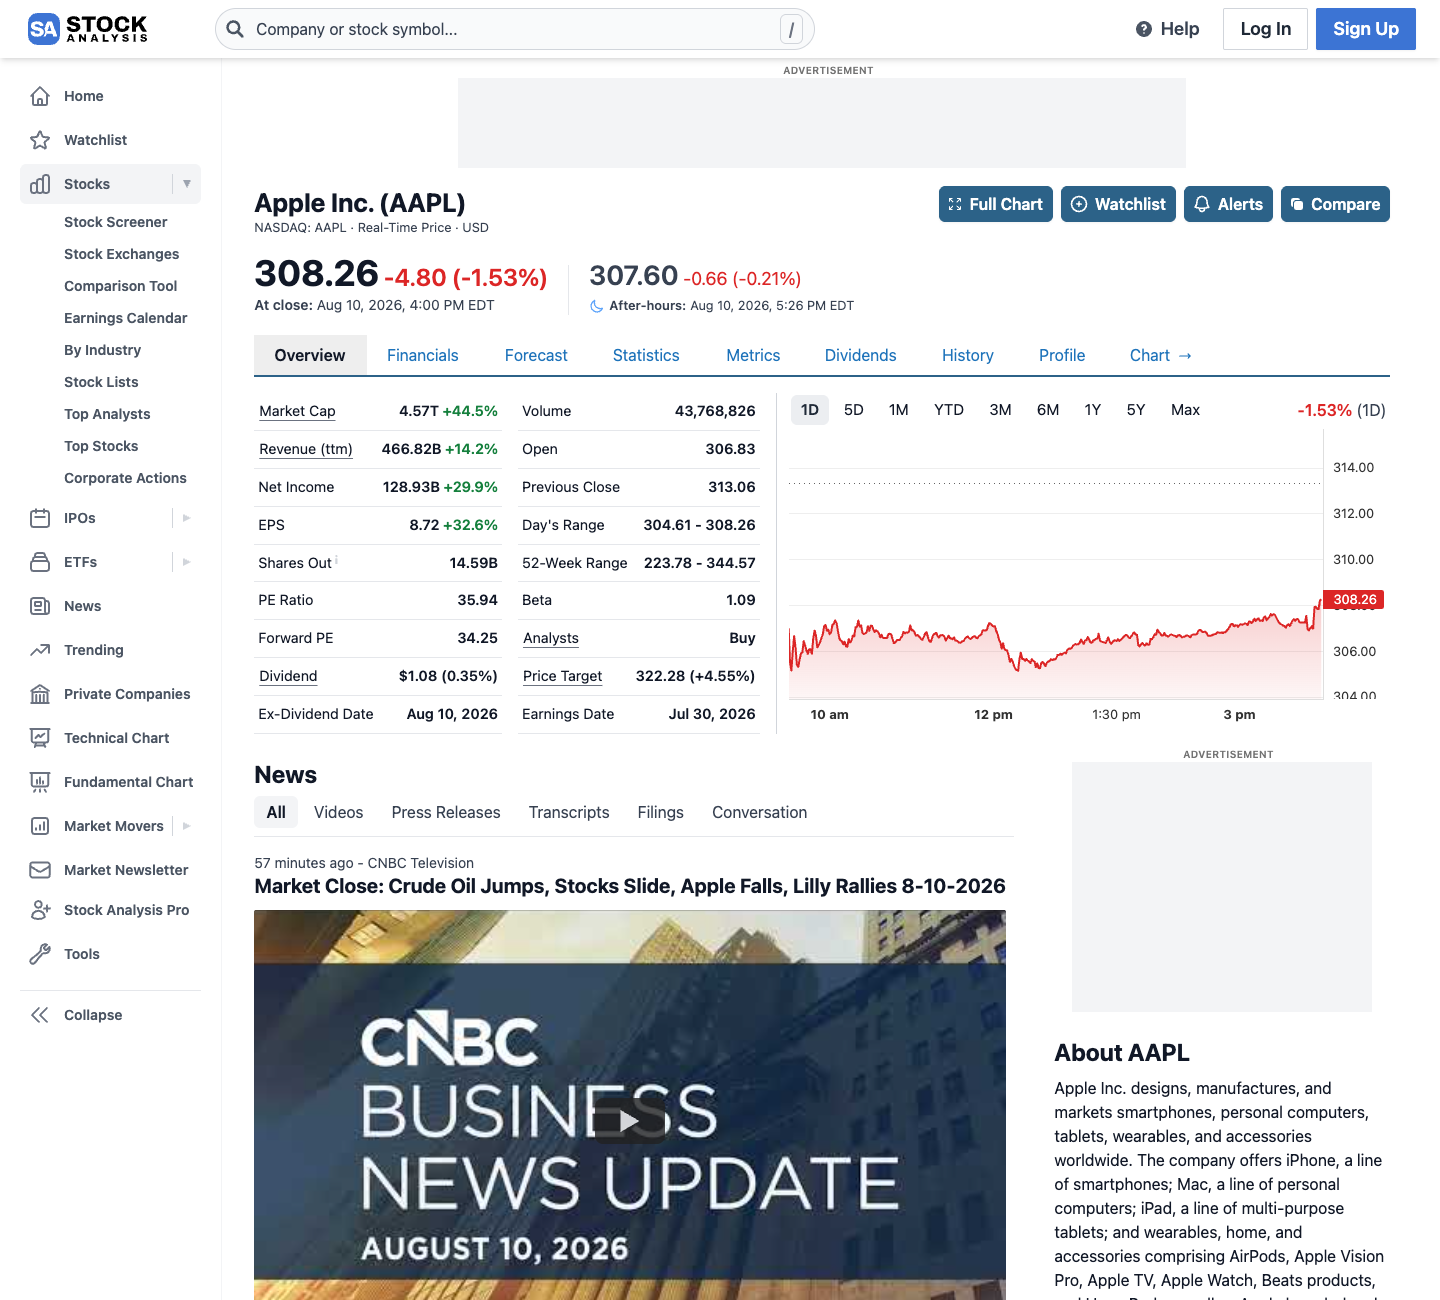
Notice the stats panel: market cap, P/E, revenue, and dividend yield, all visible in one glance.

Notice it is the exact same panel for Microsoft: same questions, new answers.
Your fifteen minute scorecard
Copy this table onto paper and fill it in, one column per company. The overview page gives you market cap, P/E, revenue, and dividend yield; click through to the financials and ratios pages for the rest.
| Yardstick | Apple | Microsoft |
|---|---|---|
| Market cap | ||
| P/E ratio | ||
| Revenue, last full year | ||
| Net margin (net income / revenue) | ||
| Dividend yield | ||
| Debt vs cash: which pile is bigger? |
Now the fun part: asking what the numbers are saying.
- Which keeps more profit per ₹100 of sales? Microsoft’s net margin is above 35%; Apple’s is about 24%. Software is almost free to copy, and phones are not. The type of business shows up directly in the margin.
- Which is priced higher per rupee of profit? Compare the two P/Es. Whichever is bigger carries the heavier expectations, and Chapter 5 told you what heavy expectations can do.
- Which do you want to read more about? That is the real output of this exercise: not an answer, but your next question.
To anchor one number: in its 2024 financial year (Microsoft’s ends in June), Microsoft’s revenue was about $245 billion, roughly ₹20 lakh crore, with net income of about $88 billion. Apple’s sales are bigger; Microsoft’s margins are richer. Two giants, two different shapes.
One rule before you reuse this scorecard on other pairs. It works here because Apple and Microsoft are the same kind of animal. Point it at a bank and some rows quietly break: a bank has no cost of goods sold, so its margins mean something else entirely, and banking rules force it to hold a thick cushion of equity, so its ROE looks low next to a software giant’s. That does not make the bank a worse business. It makes the comparison wrong. The fix is simple: compare a company with a true peer, or with its own past.
One honest sentence before you start feeling like an expert: fifteen minutes gives you good questions, not conclusions. Professionals spend weeks on what you just sketched. But fifteen honest minutes with real numbers beat fifteen hours of hot tips from television or WhatsApp.
Try it yourself
Do the scorecard above, then pick the one difference that surprised you most and chase it. If the margins surprised you, open both companies’ ratios pages and compare ten years of gross margins. If the P/E surprised you, open both forecast pages and compare the growth analysts expect. End by writing one sentence: “The thing I most want to check next is…” That sentence is how real research begins.
Key takeaways
- The same yardsticks on two companies make their differences jump out.
- Business type explains margin: software keeps more per rupee of sales than hardware.
- A written scorecard beats a gut feeling every single time.
- The product of a good comparison is your next question, never a buy decision.
- Compare with a true peer or the company’s own past; one fixed pass mark for every business will fool you.
Read one real thing: Microsoft’s filing list on SEC.gov. Notice that Microsoft files a 10-K every year just like Apple, with the same statement structure; the forms you learned on one company work on all of them.
Watch this chapter
The video edition, on our YouTube channel
Listen to this chapter
Read by Ritu, a synthetic voice from Sarvam AI