RRG with single stocks
What you will learn
- How to plot individual companies on an RRG instead of sectors
- Why single stocks bounce around more than sectors
- How to read Apple’s position against the S&P 500
- What a cluster of similar stocks on the map tells you
So far our map carried sectors, big baskets holding hundreds of companies. But nothing stops you from putting individual stocks on an RRG. Instead of “technology” as a basket, you can plot Apple itself, Microsoft, Nvidia, Alphabet, Amazon, and Meta, all measured against the S&P 500. On StockCharts you simply type the tickers into the RRG tool, with the S&P 500 index, $SPX, as the benchmark in the middle.
It is the difference between tracking whole school houses in a sports competition and tracking individual players. Houses move steadily because one player’s off day barely matters. Individual players swing wildly.
Why single stocks are jumpier
A sector fund averages hundreds of companies, so one company’s shocking news barely ripples the basket. A single stock has no such cushion. One earnings report, one product delay, one lawsuit, and the price can jump 10% in a day (for a $3 trillion company like Apple, that is about $300 billion of value moving, roughly 25 lakh crore rupees, on one piece of news).
On the RRG this means:
- Single-stock tails are longer and loopier than sector tails.
- A stock can visit all four quadrants within a few months.
- Rotations are faster and reverse more often, so the clockwise pattern is less reliable than with sectors.
A worked example: Apple versus the giants
Picture an RRG with the S&P 500 index, $SPX, at the centre and six dots: Apple (AAPL), Microsoft (MSFT), Nvidia (NVDA), Alphabet (GOOGL), Amazon (AMZN), and Meta (META). Our capture, weekly over three years, shows this:
- Microsoft in Improving, tail climbing up and right toward the Leading border: still behind the market over the measured period, but closing the gap fast.
- Apple in Leading, with its tail curling underneath it: ahead of the S&P 500, though the bend warns that no lead is guaranteed.
- Nvidia and Amazon in Weakening, tails bending down: still ahead of the market, but their leads are shrinking.
- Alphabet and Meta in Lagging, Meta sitting near the Improving border: behind the market, with Meta showing the first flicker of recovery.
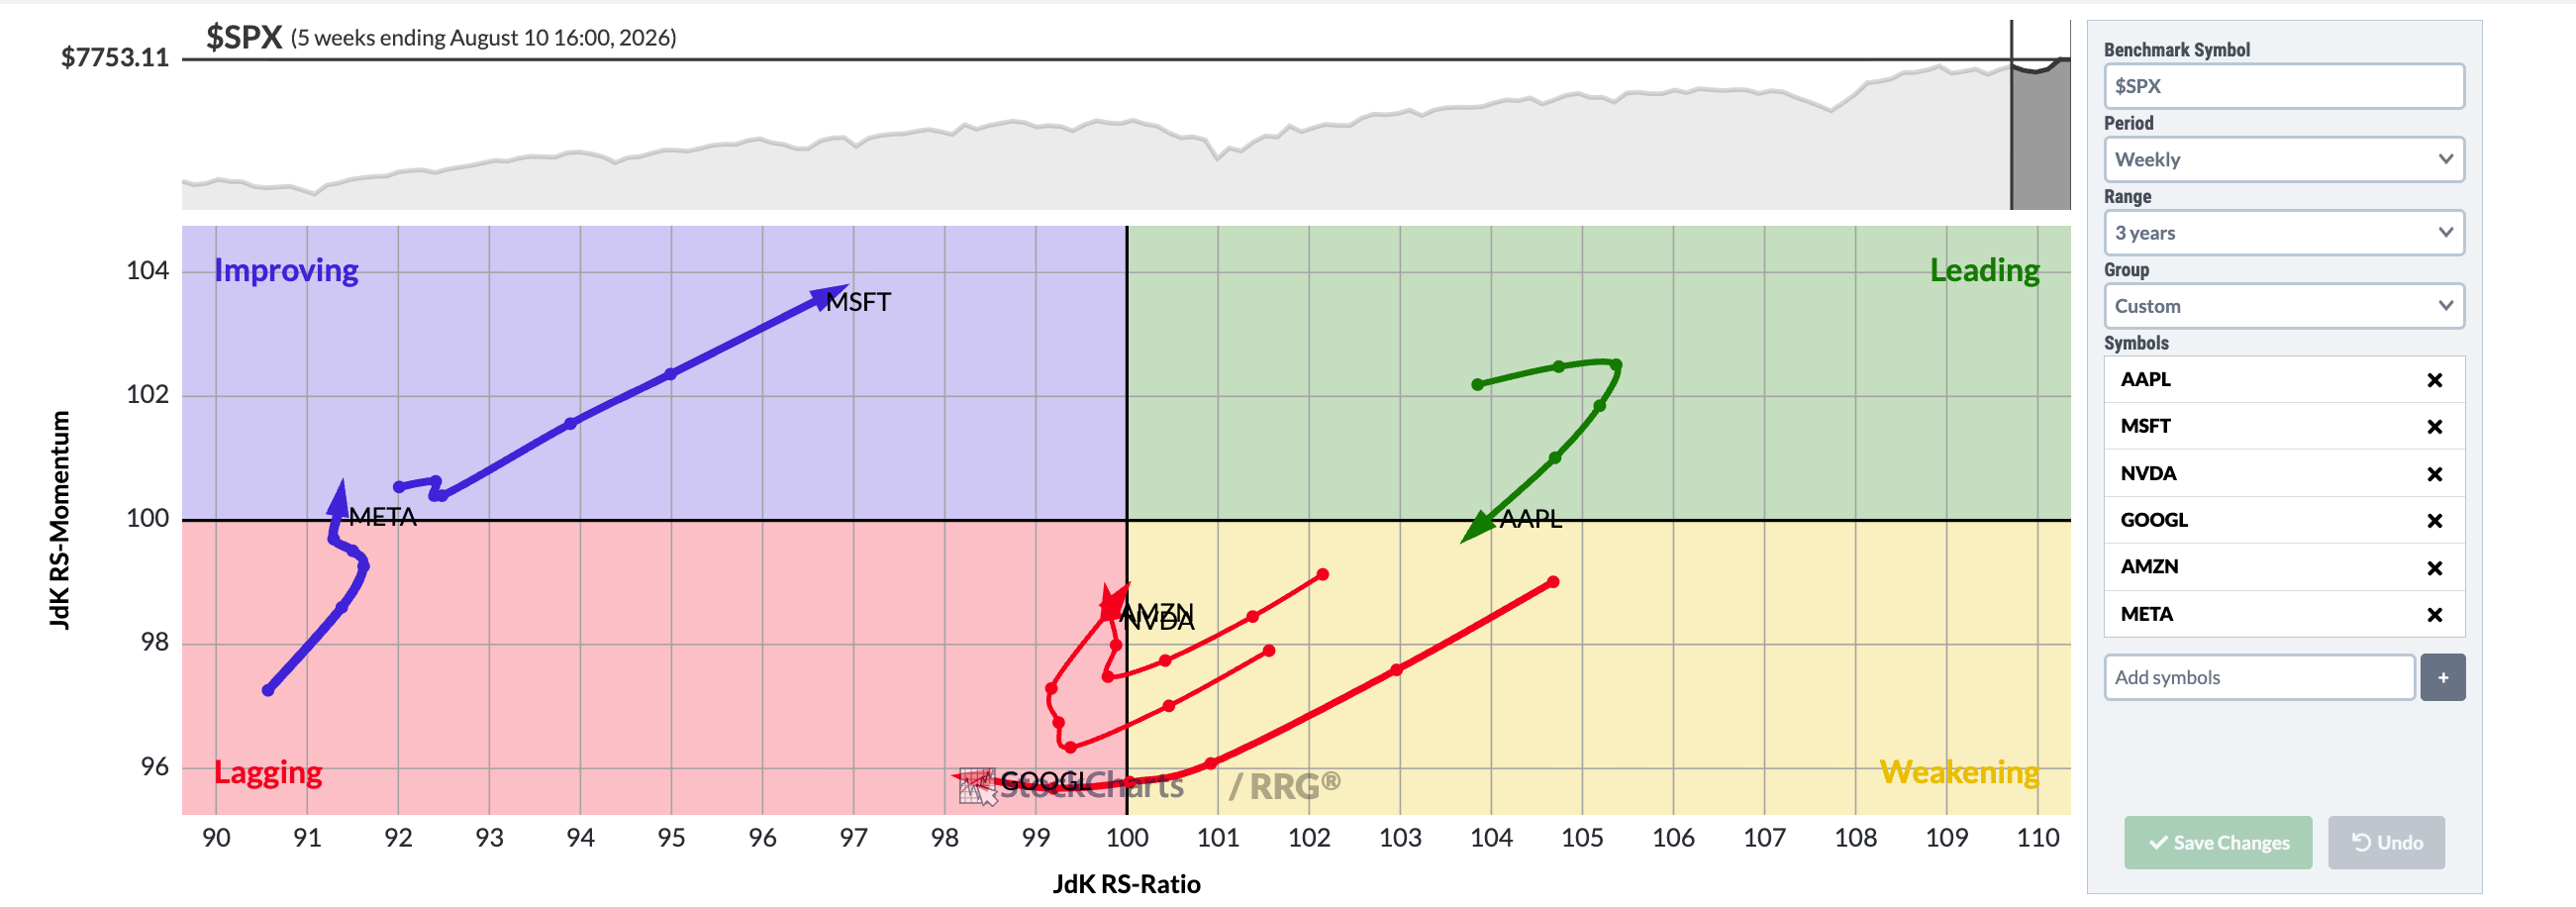
Chart courtesy of StockCharts.com
The settings panel shows the recipe: benchmark $SPX, weekly period, three year range. The reading rule is identical for stocks and indices: every dot is judged against the benchmark at the centre, and its quadrant describes a gap with the market, not whether a price went up or down.
The notebook sentence: “Among the giants, momentum currently favours Microsoft, Meta is stirring in Lagging, and Nvidia and Amazon are cooling.” Again, pure description. No instruction.
The cluster trick
Here is a genuinely useful habit. If Apple alone swings into Lagging while Microsoft and Nvidia stay firmly in Leading, the weakness is probably Apple-specific: something about that one company. But if the whole technology cluster sinks into Weakening together, while Coca-Cola and other defensive names rise into Improving, that smells like a broad sector rotation, the crowd moving houses, not just one player having a bad day.
One stock moving tells you about the stock. A group moving together tells you about the market’s mood. Professionals use exactly this as a check: a sector’s members must confirm the sector’s own rotation. The RRG lets you see both on one map, which is exactly why it earned a place in this classroom.
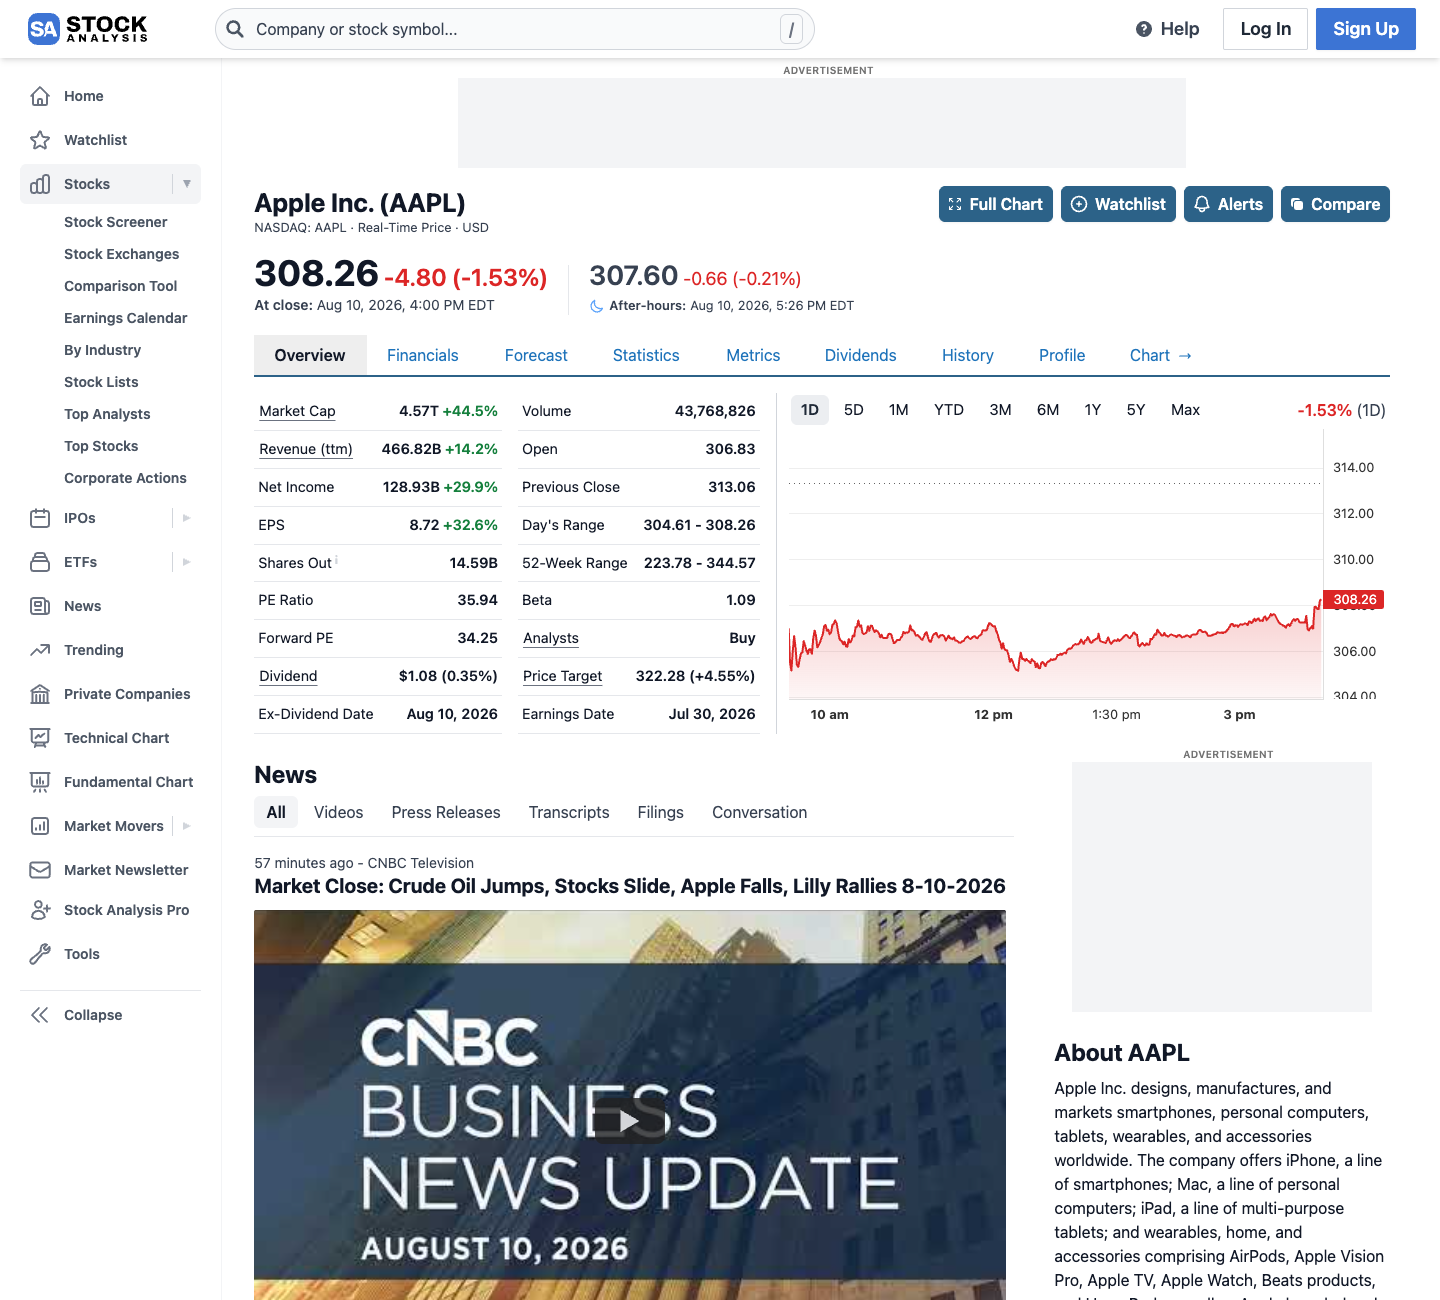 Use this page alongside the RRG: the RRG shows Apple’s position in the race, this page shows the raw performance numbers behind it.
Try it yourself
In the StockCharts RRG tool, replace the sector list with these tickers: AAPL, MSFT, NVDA, GOOGL, AMZN, META, against $SPX. Take a screenshot or sketch the positions. Write one sentence per stock: quadrant, tail direction, plain meaning. Save it and redo the exercise in two weeks to see what rotated.
Key takeaways
- You can plot single stocks on an RRG with $SPX (the S&P 500 index) as the benchmark at the centre.
- Single stocks rotate faster and reverse more often than sectors; their tails are noisier.
- A stock’s quadrant describes its gap with the market, never whether you should own it.
- A whole cluster rotating together signals a broad mood shift; one stock rotating alone signals company-specific news.
Read one real thing
Revisit the RRG screenshot above and count how many dots sit to the right of centre. Right of centre means beating the S&P 500 over the measured period, whether the dot is an index or a single stock.
Listen to this chapter
Read by Ritu, a synthetic voice from Sarvam AI