MD&A: management explains the year in its own words
What you will learn
- What MD&A is and where it sits in the 10-K
- How to read management’s explanation next to the actual numbers
- What Apple’s management said about its 2025, and what it quietly admitted
- Why MD&A is one side of the story, not the whole truth
Your report card shows the marks. But the line you and your parents actually read first is the class teacher’s remark: “Improved in maths because she practised daily; slipped in Hindi after missing classes in July.” The marks tell you what happened. The remark tells you why.
Item 7 of the 10-K is the teacher’s remark. Its official name is Management’s Discussion and Analysis of Financial Condition and Results of Operations, mercifully shortened to MD&A (say “M-D-and-A”). In it, the people running the company walk through the year’s numbers and explain, in their own words, what changed and why.
Apple’s 2025, as management tells it
Item 7 of Apple’s 2025 10-K runs from page 21 to 27. The headline numbers:
- Net sales of $416 billion, up 6% over 2024. At roughly ₹88 to a dollar, that is about ₹37 lakh crore, more than the yearly economic output of many countries.
- Net income (the profit left after all costs and taxes) of $112 billion, about ₹10 lakh crore.
Then the reasons, in management’s own words. iPhone sales rose 4% “due to higher net sales of Pro models”. Services rose 14%, driven by advertising, the App Store and cloud services. Mac rose 12% on strong laptop and desktop sales. Wearables fell 4%.
MD&A also gives you a profitability clue. Gross margin, the share of each rupee of sales left after making the product or delivering the service, was 46.9% overall. But split it: 36.8% for products, 75.4% for services. Selling a song, a storage plan or an ad is far more profitable per rupee than selling a phone. That single pair of numbers explains why Apple keeps pushing services.
And notice the honest admission buried in the margin discussion: product profitability was partly pulled down by “tariff costs”. MD&A is where management must connect the year’s events, like the new tariffs, to the year’s numbers.
The section ends with liquidity, meaning how much cash and near-cash the company has to pay its bills. Apple closed 2025 with about $132 billion in cash and marketable securities, roughly ₹12 lakh crore. Whatever else happens, the electricity bill is covered.
Read the words next to the numbers
MD&A works best with the actual tables open beside it. The tables tell you what; MD&A tells you management’s why. If the why ever sounds too smooth for the what you see in the table, trust the table.
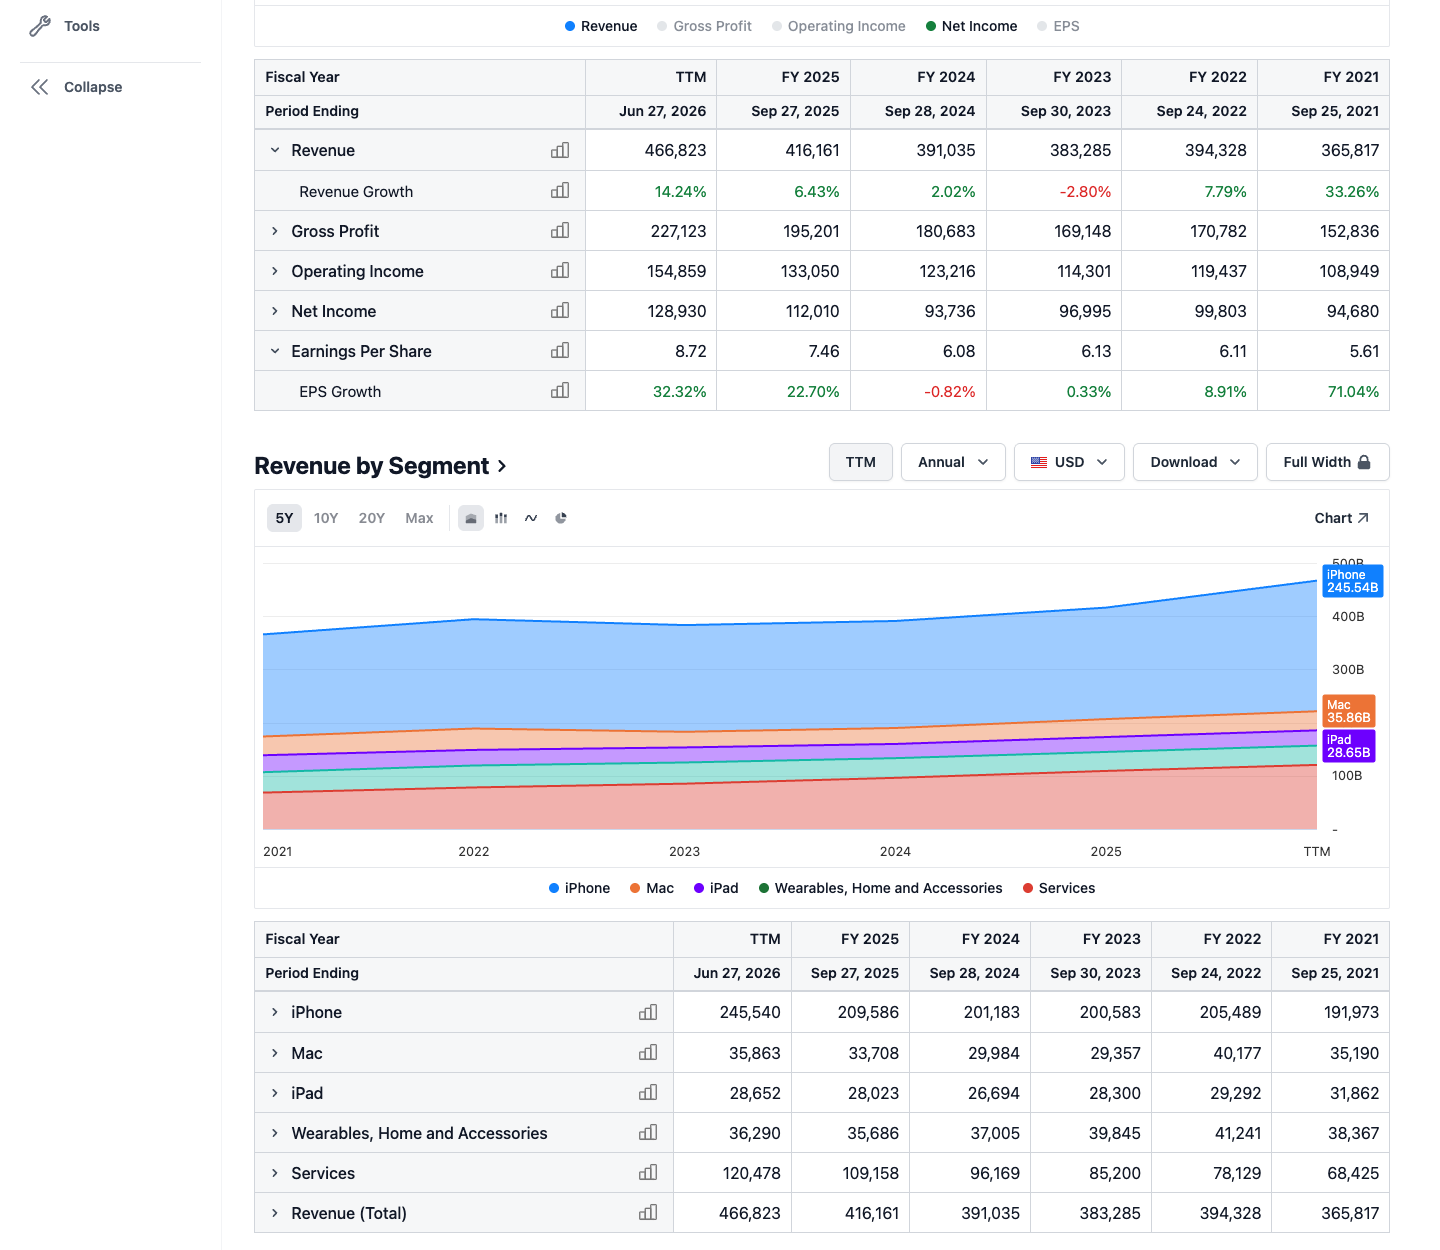
This is the “what”: revenue and profit, year by year. Notice how the 6% sales growth shows up here as a bare number, with no reason attached.
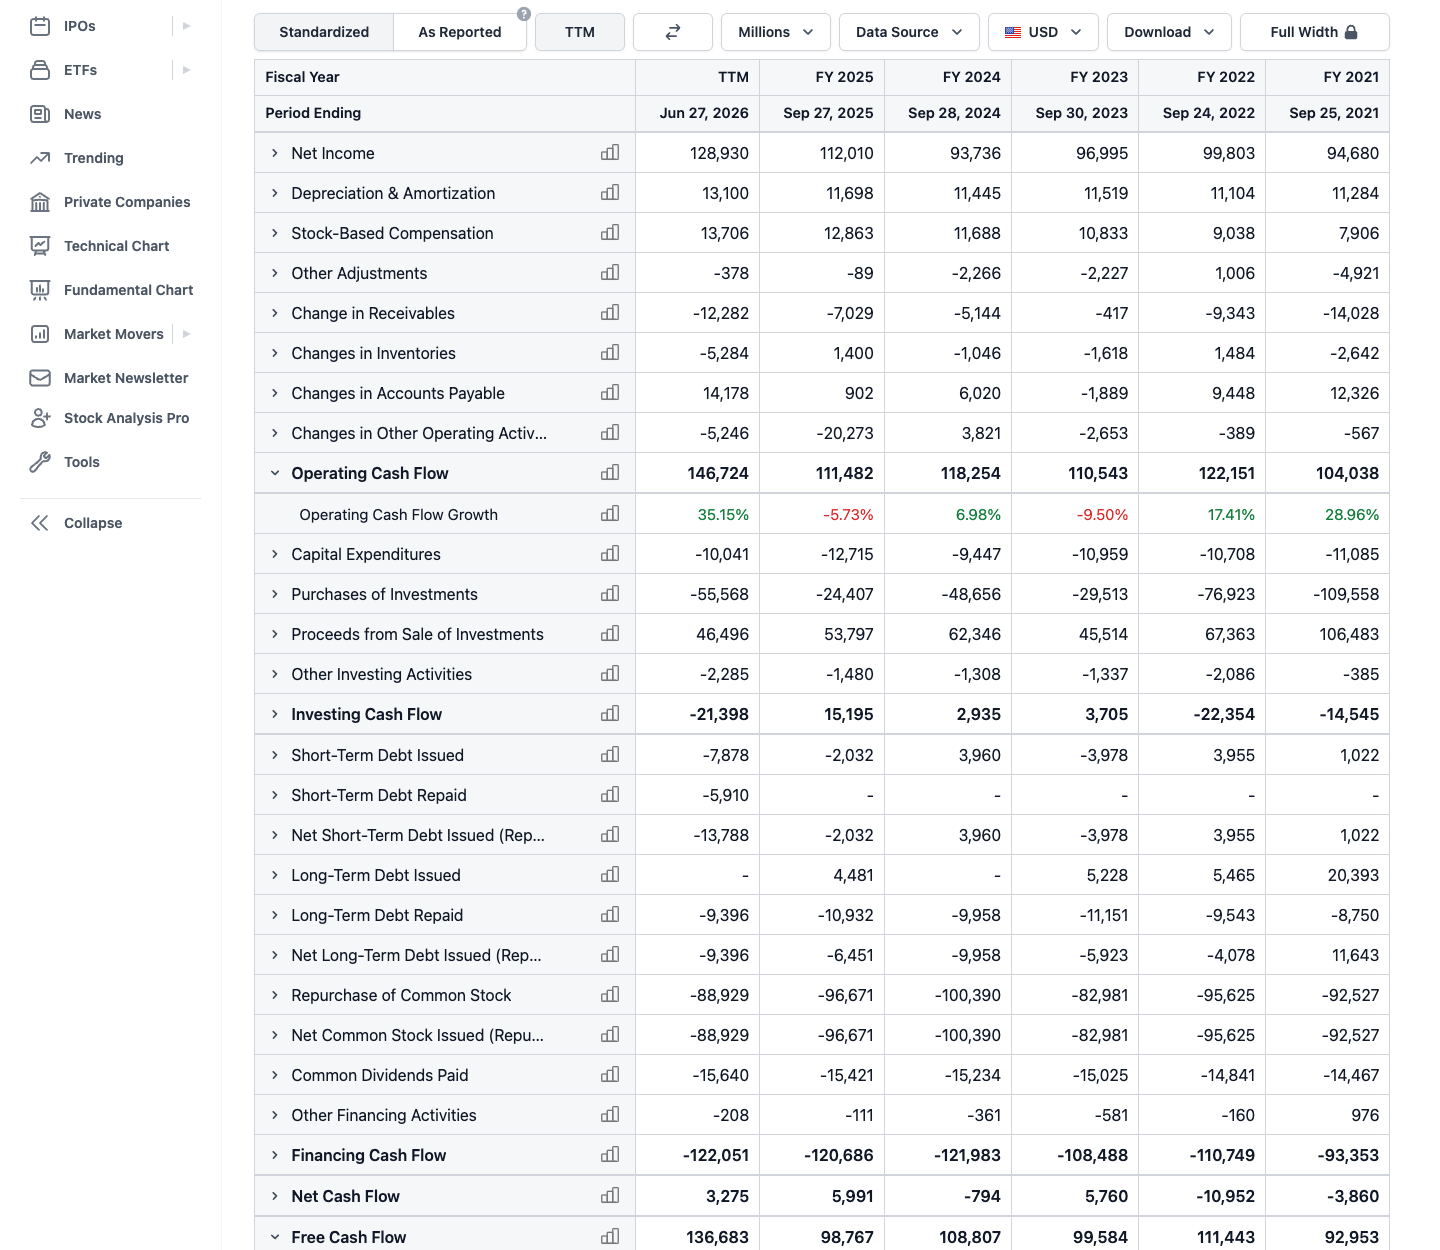
MD&A’s liquidity discussion is a commentary on exactly this table: how much cash the business generated and where it went.
Try it yourself
Open the Apple financials page on StockAnalysis in one tab and Item 7 of Apple’s 10-K in another. Find Services in both: the table shows it grew 14%, and MD&A gives the reasons. Write one line joining the two: “Services grew 14% because…”
Key takeaways
- MD&A (Item 7) is management explaining the year in words: what changed and why.
- Always read it beside the real tables. Words give the why; numbers give the what.
- Apple’s 2025: sales up 6% to $416 billion, led by Pro iPhones and services, with services far more profitable per rupee than hardware.
- MD&A is truthful in structure but promotional in tone. It is management’s side of the story, so verify it against the numbers.
Read one real thing: Item 7 of Apple’s 2025 10-K, pages 21 to 27. Notice how every big number in the tables gets one or two sentences of plain explanation right below it.
Listen to this chapter
Read by Ritu, a synthetic voice from Sarvam AI